Service: Business Intelligence

Industry: Services – quality assurance, testing, inspection, and certification

Department: Marketing

Size: 40,000+ employees in over 100 countries

Revenue: 2-3 bn GBP / 3-4 Bn EUR (2020)
Service: Business Intelligence
Industry: Services – quality assurance, testing, inspection, and certification
Department: Marketing
Size: 40,000+ employees in over 100 countries
Revenue: 2-3 bn GBP / 3-4 Bn EUR (2020)
Create a fully automated marketing funnel dashboard in six months
As an international company with business in over 100 different countries and more than 40,000 employees, keeping track of all the marketing efforts is a mammoth task. Maintaining an overview of the results achieved in each location and drawing conclusions for implementing processes or changing strategies on a global level entails a huge number of resources.
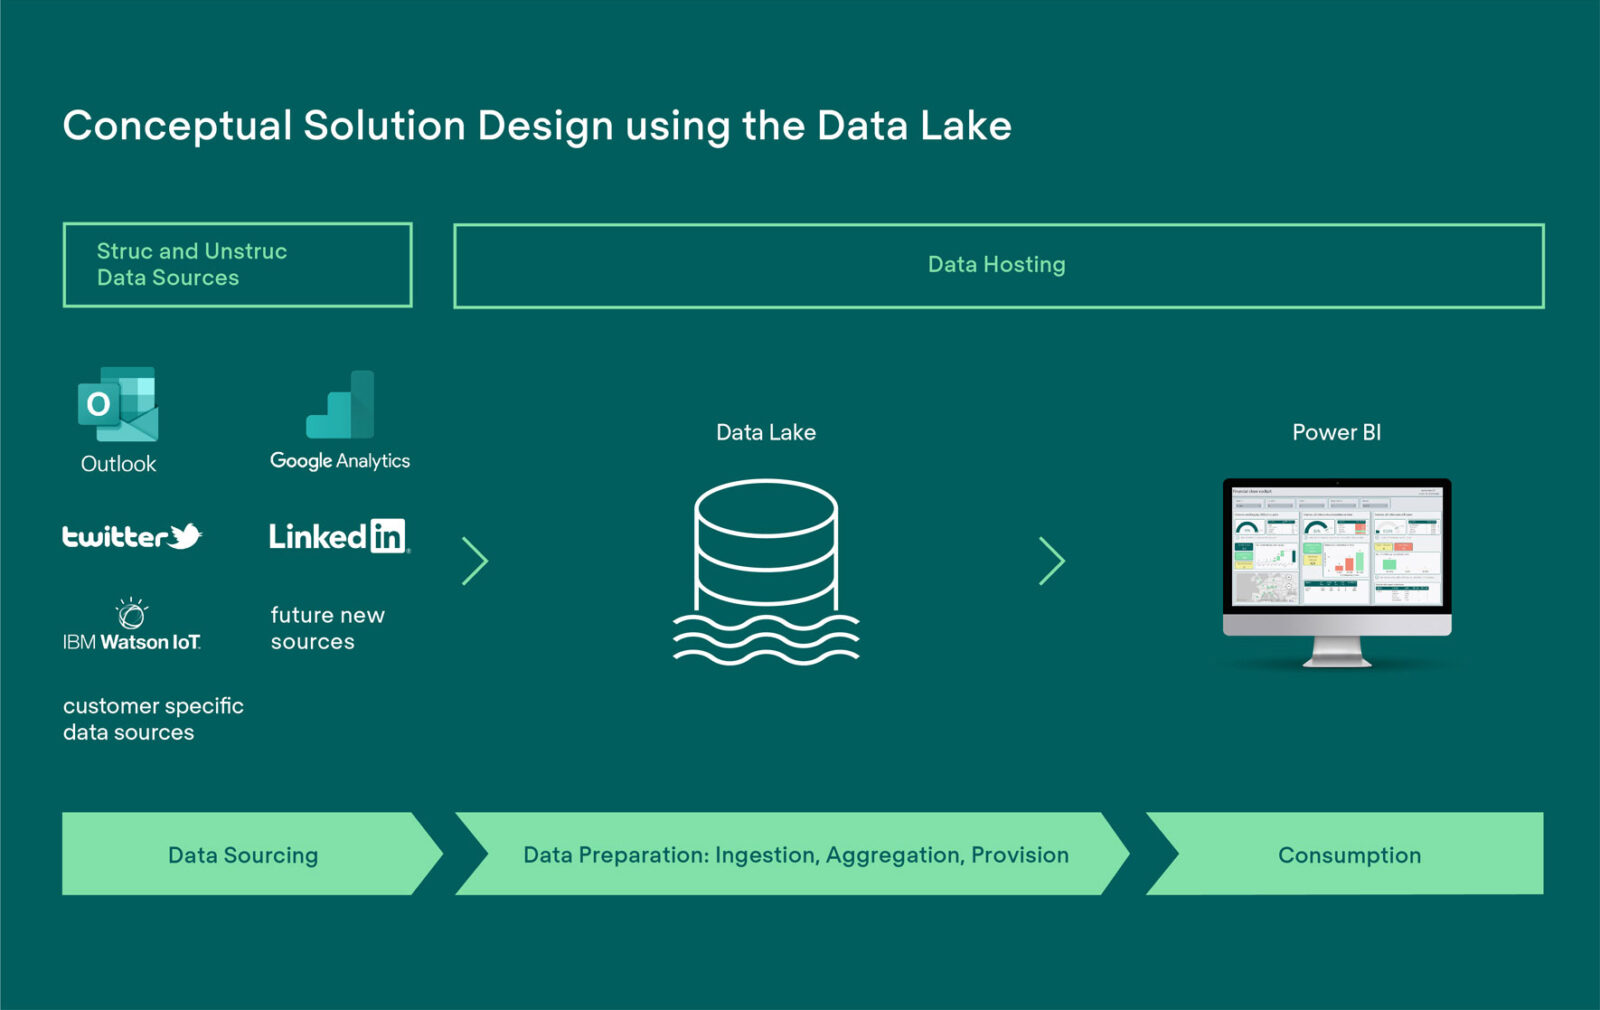
Automating data by extracting from different sources into a single source of truth is both time- and resource-saving. Knowing the customer’s behaviour in each stage of the funnel and how it changes by location makes it possible to allocate a budget to the actions, which achieves more engagement and value for customers and therefore for the business.
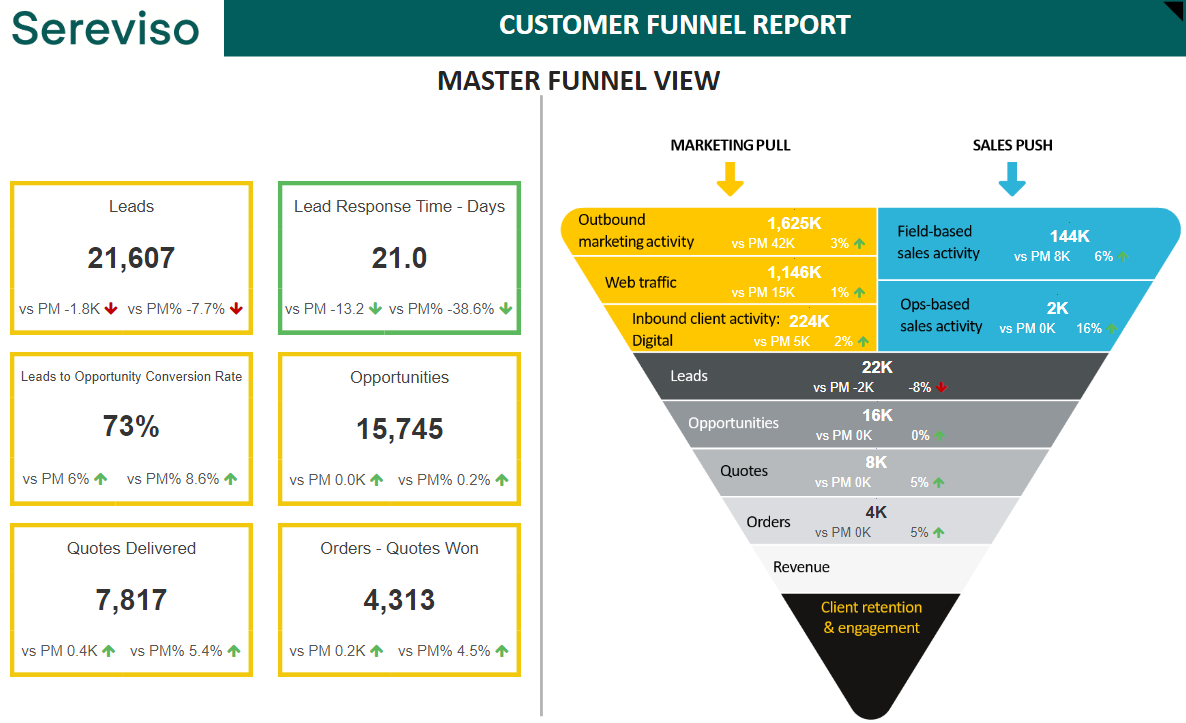
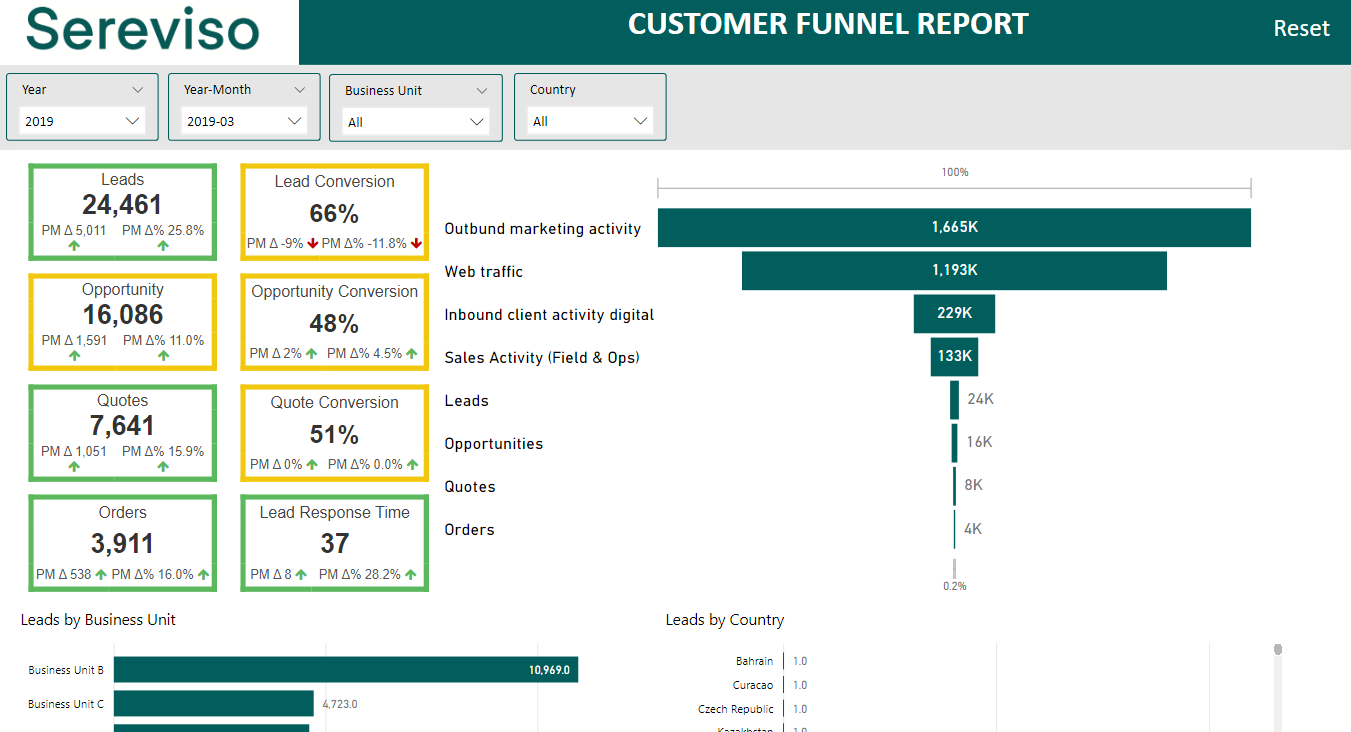
Thus, the marketing department aimed to create a customer funnel dashboard that provides an up-to-date overview of all marketing efforts. This helps understand which efforts attract more leads and where they must focus sales efforts to an even greater extent. Sales effectiveness in activities and the conversion rate can be ramped up as a result.
Low levels of collaboration
Management at the headquarters of large multinational companies often faces the challenge of keeping up-to-date with the status of different subsidiaries around the world. That is why it is imperative to build a collaborative dashboard that allows authorised users within the organisation to directly access the data insights to change, understand and analyse the data.
Low data accuracy
The biggest challenges arise due to the huge amount of data saved in different places, missing files, modifications not being tracked, and gathering data from at least five different data sources. The improper organisation of this inevitably leads to data that doesn’t match, thus creating distrust. Ultimately, this forces the company to work at a slower pace, both in decision-making as well as in the overall processes.
Non-standardised KPI definitions
The different marketing and sales departments around the globe have different key performance indicators (KPIs) that are relevant for each location. While this may work well for each location individually, the responsible management for these locations will have difficulties tracking the overall performance, as non-harmonised KPI definitions have to be consolidated first – only then do they reflect a true picture when combined. This additional consolidation step is a typical feature of non-harmonised systems and KPIs, creating a lot of manual work that could be avoided if global standards are used and adhered to.
Lack of correct insights for decision-making
Finally, partly caused by the challenges listed above, not having a global view of KPIs makes the decision-making process a lot more difficult. Also, companies risk making erroneous decisions that could have been avoided by taking a holistic approach. Thus, it’s crucial to be aware of the current global status and how the customer funnel is performing on each level – globally, nationally, and locally.
The project was divided into three main phases, with a total duration of approx. one year and three months.
Phase 1: Assess, understand, and define
This phase marked the beginning of the project. Its primary goals were:
Phase 2: Piloting
After having defined what to look at and how to report on it, the buy-in of the end-users and leadership is key to reaching a highly satisfactory result for all parties involved. The pilot phase consisted of the following elements:
Phase 3: Development & deployment
In this final phase, the system becomes fully automated, all data pipelines are established, the mock-ups are turned into a final product and the tool is rolled out to the community.